One of the essential elements of a quality management system (QMS) is continuous improvement. It is the process of making ongoing improvements to products, services, or processes through changes that occur incrementally or all at once. Continuous improvement enables organizations to sustain high performance, meet customer expectations, and adapt quickly to changing market conditions.
Regulatory bodies like ISO outline procedures for monitoring, measuring, and analyzing the processes that support a QMS. Similarly, the Medical Device Single Audit Program (MDSAP), which is governed by the FDA and other regulatory bodies across the globe, has published a continual improvement procedure. It provides organizations guidance for evaluating operational performance and identifying areas that need adjustment.
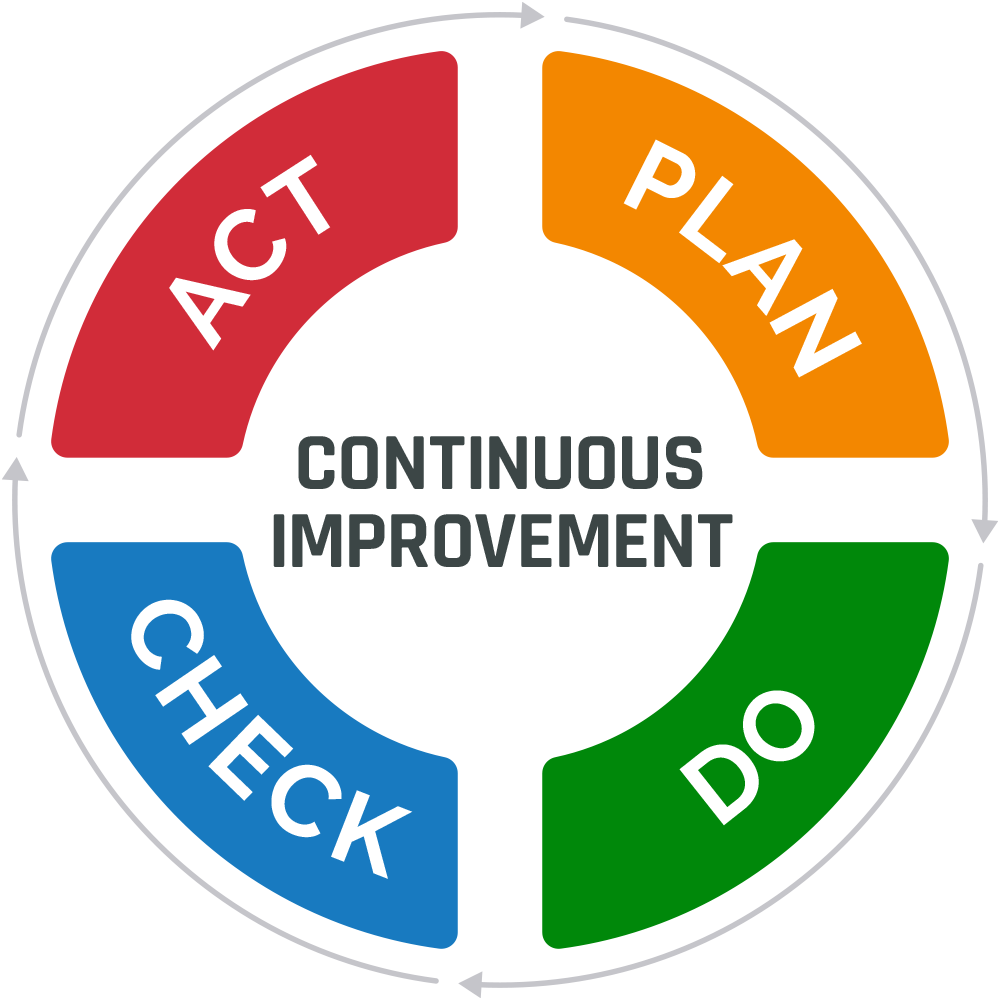
Many of today’s continuous improvement methods stem from Walter Shewhart’s Plan-Do-Check-Act (PDCA) cycle. Using this approach, an organization’s senior management team establishes specific goals and objectives for improvement (Plan). Next, employees implement changes to meet the defined targets (Do). The performance of the changes is measured to determine their effectiveness (Check). If the changes are deemed successful, they are implemented as a standard practice (Act). If the changes are ineffective, the organization will repeat the cycle.
Here, we further explore the various tools and methodologies for measuring performance and driving continuous improvement across your organization.
Companies must determine the different areas and business processes that require monitoring. Additionally, they must implement effective measurement tools to gather valid results that ensure continuous improvement. To comply with industry regulations and reach their business targets, manufacturers focus on monitoring processes that support their quality objectives. These processes are typically tied to areas like product development, operational efficiency, safety, delivery, and customer service.
Key factors to consider:
Widely used monitoring and measurement tools include:
Once the appropriate information and data has been gathered, organizations can start to evaluate the effectiveness of their QMS as well as the conformity of their products, services, and supply chain partners to applicable regulations and standards.
Some enterprise product lifecycle management (PLM) and QMS solutions include analytics tools to help organizations readily assess their product and quality data. Convenient dashboards with preconfigured KPIs and reports can be leveraged to gain deeper insights into:
With access to this information, teams can readily identify areas for process improvement and address business risks and opportunities.
As prescribed in the PDCA model, senior management should establish an action plan for implementing improvements based on the results of the analysis. This plan, along with the expected outcomes, should be documented and clearly communicated to all impacted teams.
Improvements may involve retraining employees, changing certain processes, or adding resources (e.g., equipment, staff, new technology). After a set period, employees should evaluate the performance of any changes to verify that they are meeting their defined targets. In addition, controls should be established to keep process variation within acceptable limits.
Once improvement initiatives are deemed successful, organizations can update the supporting QMS documentation. This may include standard operating procedures (SOPs), work instructions, assembly instructions, customer requirements, approved supplier/vendor lists (ASLs/AVLs), and training records. Having a centralized system like Cloud PLM and Cloud QMS solutions automates the management of product information and quality processes so that organizations can better track and control changes that are made over time and demonstrate compliance.
As the term implies, “continuous improvement” is an ongoing practice that requires routine monitoring, evaluation, and refinement of products, services, and processes. Having the proper tools and resources to regularly assess your performance and make incremental improvements will ensure that you reach your business targets and gain a competitive advantage.
To learn even more about QMS software, check out our Ultimate QMS Guide.